Computed sky · Meghnad Chitnis
Making a planet go backwards
Retrograde motion built from two circles: Mars's 2020 loop computed month by month, its turning points located, and the error the model carries.
Two ways in. The gist assumes you have never met any of this before.
Mars has never gone backwards. It has never slowed, stopped, turned, stopped again and set off the way it came. Through the whole of a retrograde it keeps going the same way round the Sun at very nearly the same speed. The backwards motion is real, it is visible, it can be timed to the hour, and none of it happens to Mars.
It happens to the line between us and Mars. Earth runs on the inside track and goes faster, so once every couple of years it catches Mars up and passes it. For some weeks either side of the passing, the slower body appears to slide backwards against the far hills, the way a slow train does from a fast one. The hills are the fixed stars, and the sliding is what a chart prints as vakrī (वक्री), retrograde.
That is the explanation everyone gives, and on its own it is worth little: it does not say when the sliding starts, how long it lasts, or how far back it goes. Those are numbers, and two circles produce them.
Four constants
Put both planets on circles around the Sun, in the flat plane of Earth's orbit, which is the ecliptic, each moving at a steady rate. That is wrong about the real solar system, and at the end I price how wrong. It needs four numbers, all published.
Earth's circle has radius 1 astronomical unit, near enough: the published figure is 1.0000026. Its period is 365.256 days, the sidereal year, the time to return to the same star.
Mars's circle has radius 1.5237 in the same units and a period of 686.98 days. Both come from the Jet Propulsion Laboratory's table of approximate planetary elements.
Turn the periods into rates. 360 ÷ 365.256 = 0.98561 degrees a day for Earth, and 360 ÷ 686.98 = 0.52403 for Mars. Earth gains on Mars at the difference, 0.46158 degrees a day, and a full lap of gain takes 360 ÷ 0.46158 = 779.9 days. That is the synodic period: 25 and a half months from one passing to the next. Every Mars retrograde anyone has written about sits inside that rhythm.
Now positions. At any moment put Earth at (cos of its longitude, sin of its longitude), and Mars at 1.5237 times the same pair taken on its own longitude. Subtract the first pair from the second and you have the arrow from Earth to Mars. The angle of that arrow, from the same zero, is the geocentric longitude of Mars: the number a chart prints. That is the model, and a calculator does a date in a minute.
One year, computed
I have taken 2020, because both turning points fall inside the one calendar year.
The model needs a starting position. Take it from the opposition, the moment Earth passes between the Sun and Mars, which on concentric circles is exactly the moment both planets share a longitude as seen from the Sun. In 2020 it fell on 13 October at about 23:26 Universal Time, with Mars at 21.08 degrees. Give both circles that longitude at that instant and let them run, forwards and back.
The right-hand column is an ephemeris, a computed table of real positions: JPL's Horizons service, apparent geocentric longitude of date at midnight Universal Time.
| 2020 | Two circles | Ephemeris | Difference |
|---|---|---|---|
| 1 January | 249.25° | 238.38° | +10.87° |
| 1 February | 270.78° | 259.39° | +11.39° |
| 1 March | 290.67° | 279.32° | +11.36° |
| 1 April | 311.52° | 300.82° | +10.71° |
| 1 May | 331.08° | 321.63° | +9.45° |
| 1 June | 350.25° | 342.70° | +7.56° |
| 1 July | 7.09° | 1.76° | +5.33° |
| 1 August | 21.20° | 18.22° | +2.98° |
| 1 September | 28.76° | 27.57° | +1.19° |
| 1 October | 25.44° | 25.05° | +0.39° |
| 1 November | 15.37° | 16.37° | −0.99° |
| 1 December | 13.98° | 17.05° | −3.07° |
Read either of the first two columns downwards, remembering that longitudes run past 360 and restart at zero, which they do here between June and July. The number climbs, stalls in September, falls through October, bottoms out in November and climbs again. Nothing was inserted to make it do that: two steady rates and a subtraction.
Where it turns
The arrow from Earth to Mars has a length and a direction, and a chart prints only the direction. So the printed number changes when Mars moves across the arrow, and not at all when it moves along the arrow, towards us or away. A turning point is the moment when Mars's motion relative to Earth lies exactly along the arrow, with nothing left over sideways.
That is enough to compute it. Earth's velocity points at right angles to the Sun-Earth line, sized by its rate. Mars's points at right angles to the Sun-Mars line, sized by its rate times its radius. Subtract Mars's velocity from Earth's, then require that nothing is left lying sideways across the Earth-Mars line. That condition reduces to one equation. Let φ be the angle between the planets seen from the Sun, r Mars's radius, and k Earth's period divided by Mars's.
cos φ = (k r² + 1) ÷ (r (1 + k))
Fill it in. k = 365.256 ÷ 686.98 = 0.53168, and r² = 2.3217. The top is 0.53168 × 2.3217 + 1 = 2.2344. The bottom is 1.5237 × 1.53168 = 2.3338. The quotient is 0.9574, and the angle whose cosine is 0.9574 is 16.79 degrees.
Notice what the equation does not contain. There is no date in it, and nothing that says which retrograde is meant.
Turn the angle into days. The gap closes at 0.46158 degrees a day, so 16.79 degrees is 36.4 days. The model says Mars turns backwards 36.4 days before every opposition and forwards 36.4 days after: 72.7 days of retrograde covering 15.9 degrees of sky, always.
For 2020 that puts the turning points on 7 September and 19 November. The ephemeris puts them on 9 September at 22:22 and 14 November at 00:35, covering 12.91 degrees in 65.1 days. Two days out at one end, five at the other, a week too long overall. Ptolemy, in the twelfth book of the Almagest, credits Apollonius with a theorem for a planet's stations under an epicycle: the same question, other machinery, the best part of two thousand years ago.
What the circle costs
The extra week the model adds has one cause: the word circle. Mars's orbit is an ellipse of eccentricity 0.0934, so its distance from the Sun runs between 1.381 and 1.666 astronomical units, and it moves fastest when nearest. Earth's eccentricity, 0.0167, adds a smaller wobble on top. Six consecutive retrogrades, from the same ephemeris:
| Turns back | Turns forward | Days | Arc |
|---|---|---|---|
| 17 Apr 2016 | 29 Jun 2016 | 73.5 | 15.8° |
| 26 Jun 2018 | 27 Aug 2018 | 61.7 | 10.6° |
| 9 Sep 2020 | 14 Nov 2020 | 65.1 | 12.9° |
| 30 Oct 2022 | 12 Jan 2023 | 74.3 | 17.5° |
| 6 Dec 2024 | 24 Feb 2025 | 79.1 | 19.2° |
| 10 Jan 2027 | 1 Apr 2027 | 81.1 | 19.5° |
[VERIFY: the last row is computed forward from JPL Horizons; recompute if this post is dated after January 2027]
That is 19 days of spread, and one model number for all of them. Catch Mars near its closest approach to the Sun, as 2018 and 2020 did, and the retrograde is short and narrow. Catch it near its farthest, as 2024 and 2027 do, and it is long and wide. A circle has no nearest and no farthest, so the model cannot tell them apart: it answers near the middle of the range and is about a week out at either end.
The longitude error behaves the same way. Around the opposition, where the retrograde happens, the two circles are good to a degree or so. Six months off, in mid-February 2020, they are 11.4 degrees out, more than a third of a sign. That is the ellipse again, and the fix is two more terms.
One further omission, listed rather than hidden. Mars's orbit is tilted 1.85 degrees to ours and my flat plane ignores it. Nearly all of that shows up as ecliptic latitude, which stood over 4 degrees below zero at the September station, and a chart's longitude column does not print it. The model is missing a real quantity from a column nobody reads.
Two things follow. A stationary point is an instant, not a state: Mars turned at twenty past ten on the evening of 9 September 2020 and looked just as it had the night before. No eye reads a rate. And the instant does not depend on which ayanāṁśa (अयनांश) the software uses. An ayanamsha is a constant subtracted from every longitude, and subtracting a constant does not move the peak of a curve. Under Lahiri's value for 2020, a little over 24 degrees, the same two turns print at about 4 degrees of Meṣa (मेष) and 21 of Mīna (मीन): different degrees, the same argument about where zero sits, identical clock times. What the word then does to the person reading it is Nikhil's subject; the number itself, and the conventions stacked under it, come out of the pipeline that builds a chart.
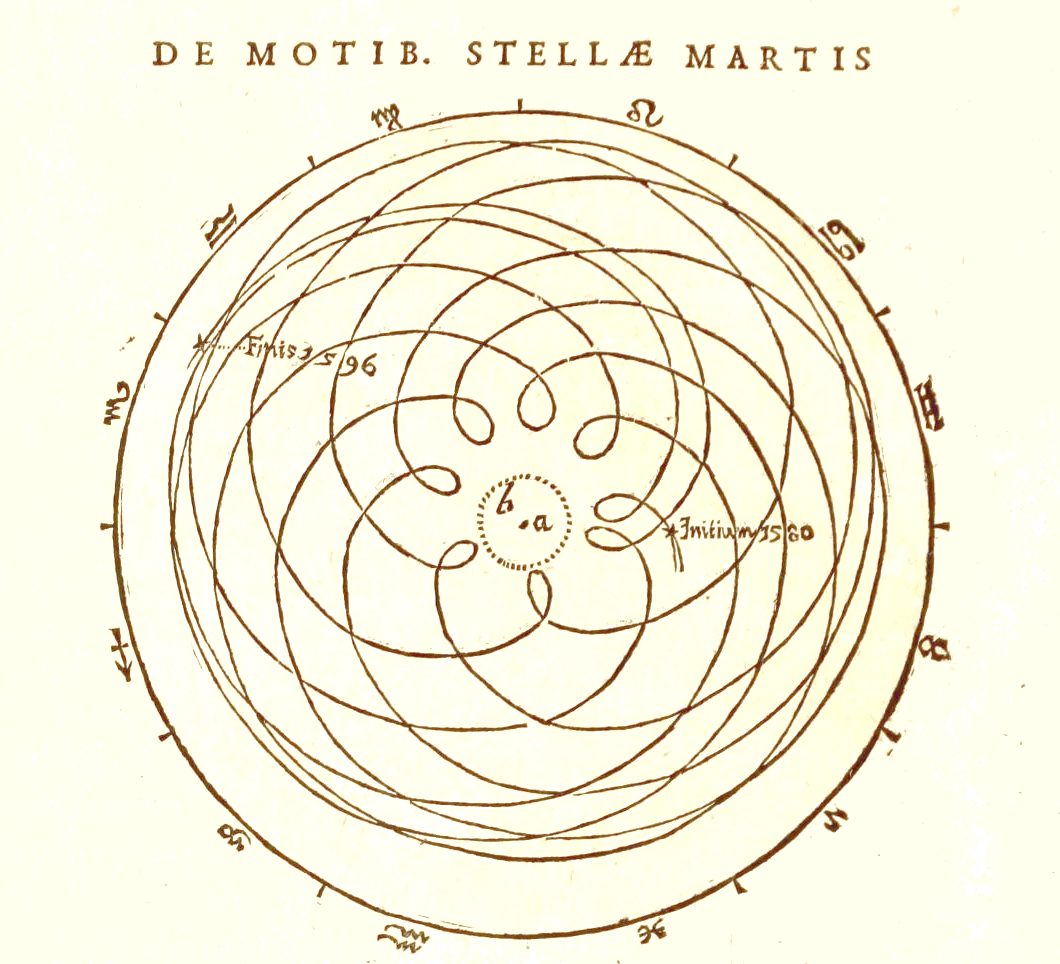
None of that machinery is new, and neither are the loops it accounts for. The figure at the top of this page is Kepler's, drawn from Tycho Brahe's observations, printed in 1609. It plots the apparent path of Mars from 1580 to 1596 as seen from the small dotted circle at the centre, which is us. One loop for each passing. The book that figure opens is the one that took the circles out and put an ellipse in, and the loops themselves were never the thing in doubt. They were the data.
Twice a week
Essays like this one, Tuesdays and Saturdays. One email per essay, and the archive is never mailed out. Subscriptions open shortly; the RSS feed is live now.
Nothing else arrives, ever.